Evaporation is the process by which a liquid turns into a gas without reaching its boiling point. Everyday examples include a puddle drying after rain or a wet towel becoming dry on a clothesline. One of the most important factors that controls how fast evaporation happens is the amount of liquid that is exposed to the air – the surface area. This project lets children compare the evaporation rate of the same amount of water in containers that have different open surfaces, giving a clear visual and measurable demonstration of the principle.
Overview
In this experiment you will fill three containers with the same volume of water, but each container will present a different exposed surface (small, medium, large). Over several days you will measure how much water remains in each container and calculate the rate of evaporation. The activity reinforces concepts of surface area, measurement, and data analysis while using only everyday household items.
Before You Begin
- Supervision: An adult should help with cutting containers (if needed), measuring water, and handling any glass or sharp objects.
- Location: Choose a spot in the house where temperature, airflow, and humidity stay roughly constant for the whole observation period – a kitchen counter away from direct sunlight or drafts works well.
- Safety: No open flames or chemicals are involved. Just keep the work area tidy and dry to avoid slips.
Materials
- Three clear containers of the same volume (e.g., three 1‑liter plastic bottles, three half‑gallon milk cartons, or three glass jars). The containers should be identical except for the way they are opened.
- Water (tap water is fine). Water is the only required material for the taxonomy.
- Measuring cup or graduated cylinder (to measure 200 mL of water for each trial).
- Ruler or tape measure (to record the diameter of the open surface).
- Permanent marker (to label each container).
- Paper towel or cloth (for any spills).
- Optional: kitchen scale (to weigh water before and after for greater accuracy).
Testable Question
Does increasing the exposed surface area of a container increase the rate at which water evaporates, when temperature, humidity, and volume are kept constant?
Hypothesis
Because evaporation occurs at the liquid‑air interface, a larger exposed surface should allow more molecules to escape per unit time. Therefore, the container with the greatest open area will lose water faster than the one with the smallest area.
Variables and Controls
| Variable | Type | How It Is Managed |
|---|---|---|
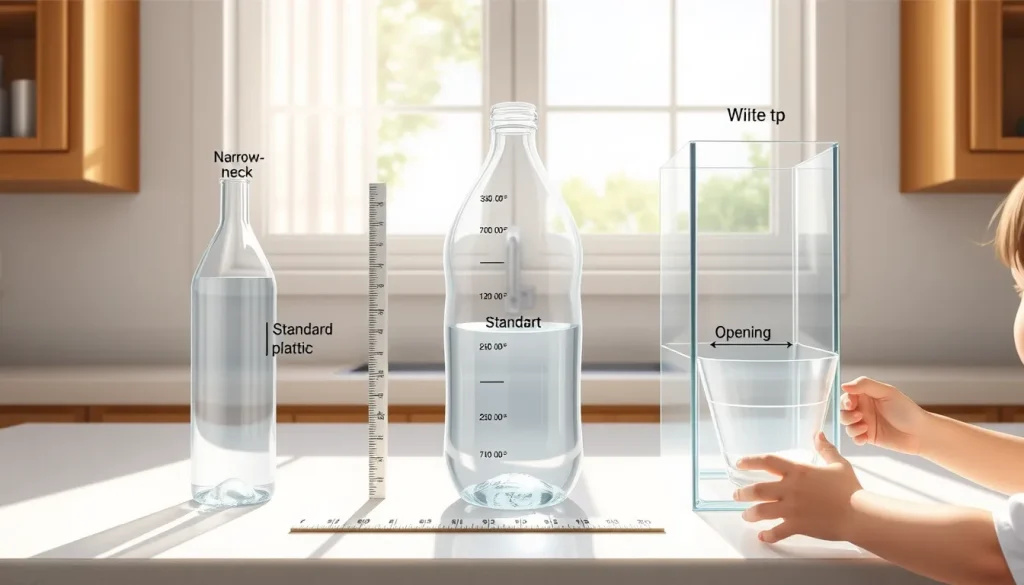
| Exposed surface area | Independent | Three containers are prepared with small (narrow opening), medium (standard opening), and large (cut to a wide opening) surfaces. |
| Evaporation rate (water loss per day) | Dependent | Measured by the change in water volume (or mass) over a set time. |
| Water volume at start | Controlled | Exactly 200 mL placed in each container. |
| Ambient temperature, humidity, and airflow | Controlled | All containers are placed together in the same location. |
| Container material | Controlled | All three containers are made of the same plastic or glass. |
Steps
- Label the three containers “Small”, “Medium”, and “Large”.
- Prepare the openings:
- Small: Keep the original narrow neck (e.g., a milk carton cut to a 2‑cm diameter opening).
- Medium: Use the container’s standard opening (about 5‑cm diameter).
- Large: Cut the top off to create a wide, rectangular opening of roughly 15 cm × 10 cm. Use scissors or a utility knife with adult help.
- Measure 200 mL of water with the measuring cup and pour it into each container. If you have a kitchen scale, you can weigh the water instead (≈200 g).
- Immediately record the initial water level (in millilitres) or mass for each container. Note the exact opening dimensions (diameter or width × height) so you can calculate surface area later.
- Place the three containers side‑by‑side on a flat surface in the chosen location. Ensure they are not stacked and that air can circulate around each one.
- Leave the containers undisturbed for 24 hours. Do not move them, and avoid covering them.
- After each 24‑hour period, re‑measure the remaining water volume (or mass) in each container and record the value.
- Repeat the measurement for at least three consecutive days (more days give clearer trends).
- When the experiment is complete, clean the containers and dry the work area.
What to Observe or Measure
For each day record:
- Date and time of measurement.
- Remaining water volume (mL) or mass (g) in each container.
- Ambient temperature (°C) and relative humidity (%) if you have a simple thermometer/hygrometer – this helps explain any day‑to‑day variation.
Data Table
| Day | Small (mL) | Medium (mL) | Large (mL) | Temp (°C) | Humidity (%) |
|---|---|---|---|---|---|
| 0 (initial) | |||||
| 1 | |||||
| 2 | |||||
| 3 | |||||
| … |
Repeated Trials
To see how reliable the pattern is, you can repeat the whole set of three containers on a different week (changing the ambient temperature slightly). Treat each repeat as a new trial and add its data to a separate table or to the same table with an extra “Trial” column.
Graphing Your Results
Plotting the data helps visualise the relationship. Create a line graph with:
- X‑axis: Days (or hours) since start.
- Y‑axis: Remaining water volume (mL).
- Three separate lines, one for each container size.
The slope of each line (change in volume per day) is the evaporation rate. You should see the steepest negative slope for the “Large” container, a gentler slope for “Medium”, and the shallowest for “Small”.
The Science Explained
Evaporation is a surface phenomenon: only molecules at the liquid’s surface can escape into the air. When the temperature is higher, molecules move faster, making escape easier. Likewise, a greater exposed surface provides more opportunities for molecules to leave at any moment. This is why the rate of evaporation increases with surface area, as confirmed by classroom investigations that compare a test tube, a beaker, and an evaporating dish [2] and by the classic seawater‑container experiment that varies container shape [1].
It is a common misconception that vapor pressure itself depends on surface area. In reality, vapor pressure is a property of the liquid at a given temperature and does not change with the amount of liquid or the area exposed [3]. However, when a container is open to the atmosphere, the liquid is not at equilibrium with its vapor; the larger the surface, the faster the net loss of liquid, even though the equilibrium vapor pressure remains the same.
Other factors that can influence the observed rate include humidity (more water vapor in the air slows evaporation) and airflow (a breeze removes saturated air near the surface) [4]. By keeping the containers together, you control these variables so that surface area is the dominant factor.
Try Another Version
Once the basic experiment is mastered, you can extend it in several ways:
- Temperature variation: Place one set of containers on a sunny windowsill and another set in a cooler room to see how temperature interacts with surface area.
- Salinity: Add a measured amount of table salt to make synthetic seawater (≈35 g salt per 965 g water) and compare its evaporation rate to fresh water [1].
- Different materials: Use metal, glass, and plastic containers of the same opening size to explore how container material (heat conductivity) influences temperature of the water and thus evaporation.
Cleanup and Disposal
When the experiment ends, pour any remaining water down the sink. Wash the containers with soap and water, dry them, and store them for future use. No hazardous waste is generated.
Next Steps
Use the data you have collected to write a short report: state the question, hypothesis, method, results (including the graph), and a conclusion that ties the observed trends back to the scientific explanation. This report can be shared with classmates, posted on a family science blog, or used as a foundation for a science‑fair project.
Related terms
- Evaporation
- The process where liquid molecules become gas and leave the surface without boiling.
- Surface area
- The amount of material exposed to the air; a larger area provides more places for molecules to escape.
- Vapor pressure
- The pressure exerted by a vapor in equilibrium with its liquid at a given temperature; it does not depend on surface area.
Sources & references
- https://webapp1.dlib.indiana.edu/virtual_disk_library/index.cgi/3720141/FID3534/MEDIA/PDFS/TS2SSAC2.PDF
- https://edu.rsc.org/download?ac=514059
- https://chemistry.stackexchange.com/questions/8133/does-rate-of-evaporation-change-with-surface-area
- https://byjus.com/chemistry/factors-affecting-rate-of-evaporation/