Understanding how plants respond to their environment is a classic hands‑on science activity. By measuring height, leaf number, or biomass over time, children can see growth as a real, quantitative process. The challenge for many families is turning those raw numbers into a picture that tells a story. This article explains every stage—from planting a seed to drawing a line graph—so that the data become a clear, trustworthy illustration of plant growth.
Orientation: What You’ll Do
In this activity you will grow several identical plants under different conditions (for example, with no fertilizer, with a low dose, and with a higher dose). Over two to four weeks you will record simple measurements such as stem height and leaf count. After the observation period you will organize the numbers in a table and create a graph that shows how each treatment affected growth.
Before You Begin
- Workspace: A sunny windowsill, a small indoor grow‑light, or a sheltered outdoor spot where temperature stays roughly constant.
- Adult supervision: Children will handle small tools (ruler, scissors) and may need help with watering and data entry.
- Time commitment: About 30 minutes to set up, then 5–10 minutes each day or every other day for measurements. Total observation period: 2–4 weeks.
Materials
| Item | Typical quantity | Everyday alternative |
|---|---|---|
| Planting containers (e.g., plastic cups or small pots) | 6–12 | Re‑used yogurt cups (remove lids) |
| Potting soil | 1 L | Garden soil mixed with compost |
| Fast‑germinating seeds (e.g., radish, bean, or lettuce) | 12–24 | Any seed you have at home |
| Ruler or measuring tape (cm) | 1 | School ruler |
| Notebook or printable data sheet | 1 | Blank paper |
| Watering can or spray bottle | 1 | Small kitchen pitcher |
| Optional: fertilizer (e.g., nitrogen source) | Small amount | Household liquid fertilizer |
Steps: Setting Up the Experiment
- Label the pots. Write the treatment name on each pot (e.g., “Control”, “Low N”, “High N”). Use a permanent marker.
- Fill with soil. Add soil to about 2 cm below the rim.
- Sow seeds. Plant 2–3 seeds per pot at the depth recommended on the seed packet. Cover lightly.
- Water gently. Moisten the soil until it feels damp but not soggy.
- Apply treatment. For the fertilizer groups, dissolve the appropriate amount of nitrogen fertilizer in a measured volume of water (e.g., 100 mg N kg⁻¹ soil for “Low N”). Apply the same volume to each pot in that group. The control pots receive the same amount of plain water.
- Place pots in the same light and temperature conditions. Keep them side‑by‑side to ensure equal exposure.
- Start the observation journal. Record the date, pot label, and any initial observations (e.g., seed depth).
- Measure regularly. Every 2–3 days, use the ruler to measure the tallest shoot from soil surface to tip. Count the number of true leaves. Record the data in the table provided below.
- Water consistently. Give each pot the same amount of water each time (e.g., 30 mL). Note any missed waterings.
- Continue for 2–4 weeks. When seedlings have developed several leaves and are clearly growing, stop measurements and move to data analysis.
What to Observe or Measure
Two simple quantitative variables work well for beginners:
- Stem height (cm): Measure from the soil surface to the tip of the longest shoot.
- Leaf count: Count all fully expanded true leaves (exclude cotyledons).
Optional qualitative notes (e.g., leaf color, wilting) can be added in the “Notes” column of the data table.

Variables and Controls
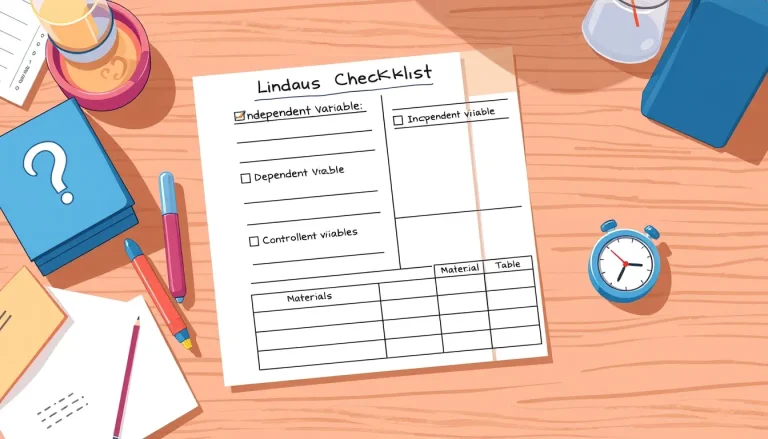
Independent variable: The factor you change, such as the amount of nitrogen fertilizer.
Dependent variables: The measurements you record—stem height and leaf count.
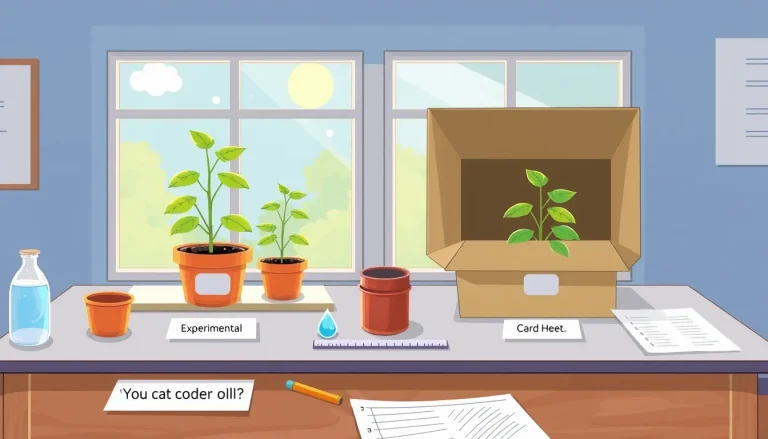
Control group: Plants that receive no added fertilizer but are otherwise treated identically. This group shows what growth looks like under baseline conditions.
Controlled variables (kept constant): Light level, temperature, pot size, soil type, watering volume, and measurement schedule. Keeping these steady ensures that any differences you see are due to the independent variable.
Repeated Trials
For reliable conclusions, use at least three pots per treatment. These are true repeats, not just “extra” plants; they let you see natural variation and calculate an average. More repeats improve confidence but also require more time and space.
Data Table: Record Your Numbers
| Day | Pot label (treatment) | Plant ID | Height (cm) | Leaf count | Notes |
|---|---|---|---|---|---|
Graphing Your Results
Graphs turn rows of numbers into a visual story. The type of graph depends on what you want to show.
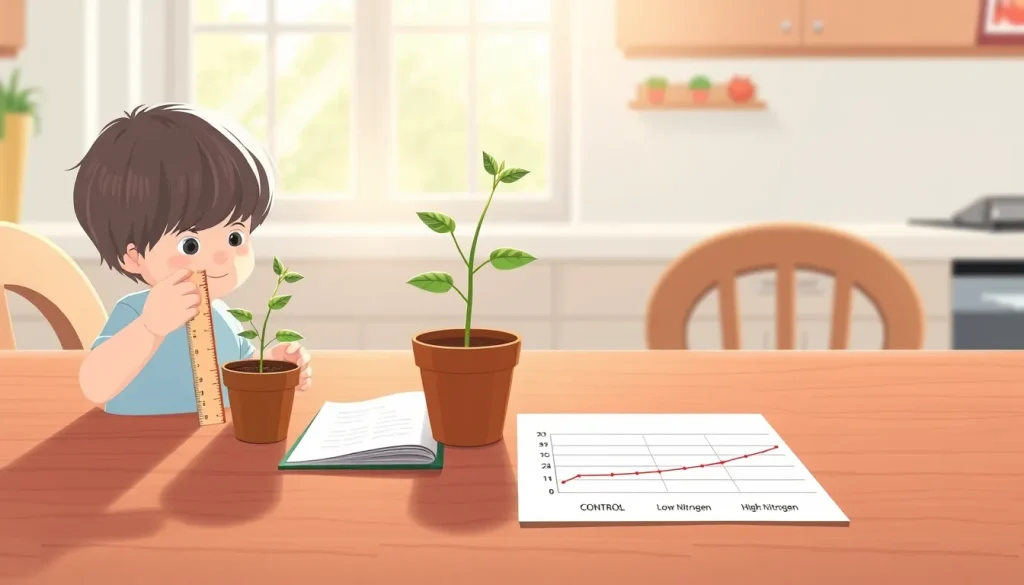
- Line graph (growth over time): Plot Day on the horizontal axis and Height (cm) on the vertical axis. Use a separate line for each treatment. This format follows the basic checklist for scientific graphs described in the graphics guide [1].
- Bar graph (final height comparison): Calculate the average final height for each treatment and display those averages as bars. Bar graphs are recommended for comparing discrete categories such as “Control”, “Low N”, and “High N” [2].
Key graph design tips:
- Label axes clearly, including units (e.g., “Height (cm)”).
- Use a legend or different colors to distinguish treatments.
- Avoid 3‑D effects or unnecessary gridlines that can obscure the data.
- Start the vertical axis at zero to prevent visual exaggeration.
Worked Example
Below is a short illustrative dataset based on a nitrogen‑fertilizer test similar to the one described in a classroom report [4]. The numbers are fictitious but realistic, showing how the data might look after 21 days.
| Day | Treatment | Height (cm) |
|---|---|---|
| 0 | Control | 2.0 |
| 0 | Low N (100 mg/kg) | 2.0 |
| 0 | High N (250 mg/kg) | 2.0 |
| 7 | Control | 4.5 |
| 7 | Low N | 5.2 |
| 7 | High N | 5.8 |
| 14 | Control | 7.0 |
| 14 | Low N | 9.1 |
| 14 | High N | 10.4 |
| 21 | Control | 8.5 |
| 21 | Low N | 11.3 |
| 21 | High N | 13.0 |
When plotted as a line graph, the three lines clearly diverge, showing that added nitrogen accelerated growth. A bar graph of the 21‑day averages would display the same trend in a compact form.
The Science Explained
Plants grow by converting light, water, and nutrients into new tissue—a process called photosynthesis. Nitrogen is a key component of chlorophyll and proteins, so supplying extra nitrogen often speeds up the building of leaves and stems, up to a point. Too much nitrogen can cause weak, overly lush growth that is susceptible to pests, but in a short, controlled experiment the differences are usually measurable.
Relative growth rate (RGR) is a valuable way to compare how quickly plants add mass relative to their size. RGR can be estimated from the slope of a height‑versus‑time line when growth is roughly linear, a method taught in many plant‑physiology modules [3]. By calculating the slope for each treatment, children can quantify “how fast” each group grew, not just “how tall” they ended up.
Troubleshooting Common Issues
- Inconsistent watering: If some pots receive more water, they may grow faster for reasons unrelated to fertilizer. Use a measured cup each time.
- Measurement error: Rulers can be misread if the plant bends. Gently straighten the stem before measuring, and record to the nearest 0.5 cm.
- Light differences: Shadows from nearby objects create uneven growth. Rotate pots regularly to give each side equal exposure.
- Wilting or disease: Remove affected plants promptly and note the issue in the “Notes” column; diseased plants should be excluded from the final analysis.
Common Misconceptions
Many beginners assume that “more fertilizer always means bigger plants.” In reality, growth follows a curve: a moderate amount boosts growth, but excessive nitrogen can lead to spindly stems or nutrient lockout. This experiment’s control group helps illustrate the baseline, while the two fertilizer levels show the point at which added nitrogen stops providing benefit.
Next Steps and Extensions
Once the basic graph is complete, families can explore further questions:
- How does changing light intensity affect the same plants?
- What is the effect of different soil types (sand vs. loam)?
- Can you calculate the relative growth rate for each treatment and compare the numbers?
Each extension reinforces the scientific method and data‑visualization skills introduced here.
FAQ
How often should I measure the plants?
Measuring every 2–3 days gives enough data points to see a trend without disturbing the plants too often. Consistency is more important than exact timing.
What if a plant wilts during the experiment?
Record the wilt in the “Notes” column and stop watering that pot. Excluding that plant from the final averages prevents a sick plant from skewing the results.
Do I need a calculator to make the graph?
No. Simple spreadsheet software (e.g., Google Sheets) can plot line or bar graphs automatically from your table. Hand‑drawn graphs are also fine for younger children.
Related terms
- Relative growth rate
- A measure of how quickly a plant adds size relative to its current size, often expressed as change in height per day.
- Control group
- Plants that receive no experimental treatment, used as a baseline for comparison.
- Independent variable
- The factor the experimenter changes, such as amount of fertilizer.
- Dependent variable
- The outcome measured, like plant height or leaf number.
Sources & references
- Using figures in technical papes – the basics, https://www.ruf.rice.edu/~bioslabs/tools/data_analysis/using_figures.html
- CALCULATIONS, GRAPHS, & STATISTICS, https://plantingscience.org/resources/9/download/usingmathv2.pdf
- Plant Growth Analysis, http://plant-growth-analysis.rcac.purdue.edu/
- Presentation of Data, https://ysu.edu/sites/default/files/academics/STEM/Workshop3DataAnalysis2020.pdf