Analyzing Plant Growth Data: From Raw Measurements to Meaningful Graphs
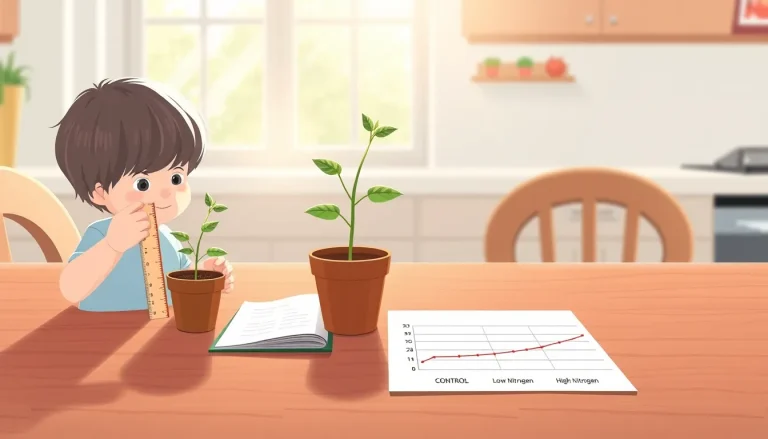
Learn how to turn everyday plant‑growth observations into clear tables and graphs. This guide walks parents, teachers, and homeschool families through setting up a…
CATEGORY COLLECTION
Teach measuring, graphing, recording observations, and fair testing techniques.
Learn how to turn everyday plant‑growth observations into clear tables and graphs. This guide walks parents, teachers, and homeschool families through setting up a…

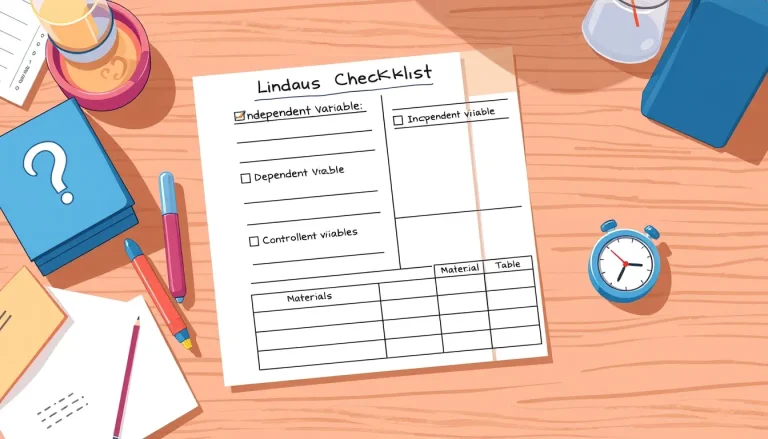
A clear, printable checklist helps children identify independent, dependent, and controlled variables, ensuring fair tests and reliable conclusions. This guide explains the terminology, shows…
Learn how to design clear, reliable data tables for plant‑growth investigations, from choosing columns and units to recording observations, handling variables, and turning results…
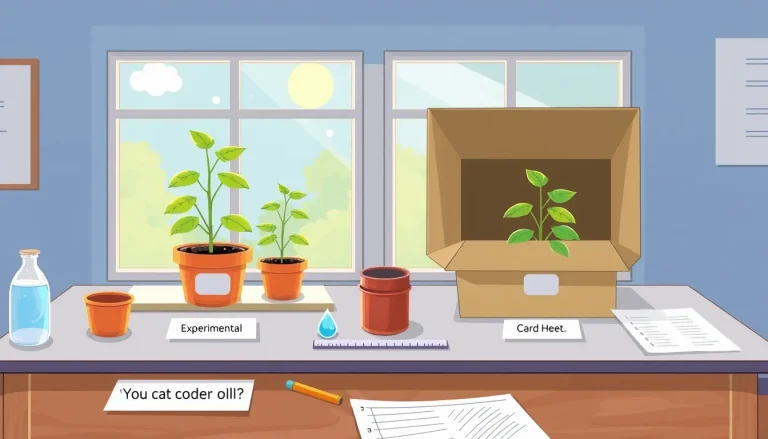
A control group lets students see what would happen without the experimental change, making results trustworthy. This guide shows how to set up, run,…
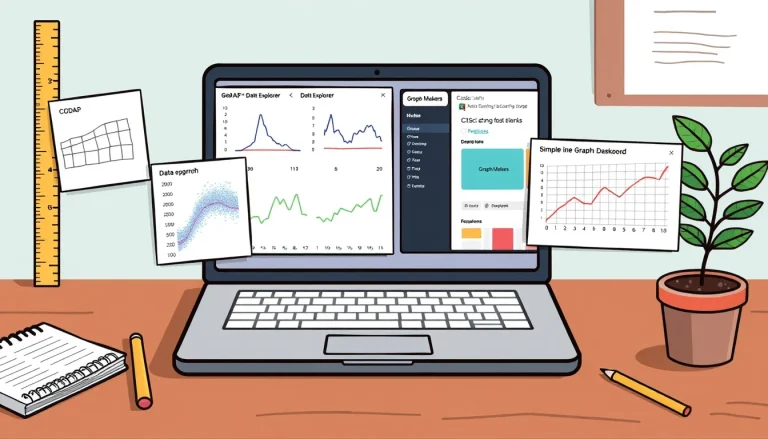
Discover four free web‑based tools—CODAP, Data Explorer, CitSci.org, and Graph Makers—that let students create clear graphs, analyze results, and share their findings with classmates…
Learn how to collect reliable data, organize it in clear tables, and turn it into informative graphs. Repeating trials, averaging results, and showing variability…
The scientific method helps children turn curiosity into clear evidence by guiding them through asking questions, forming hypotheses, testing with simple experiments, and drawing…