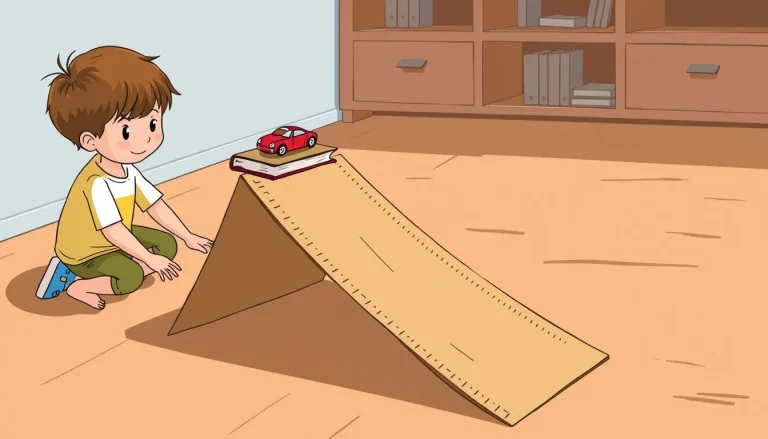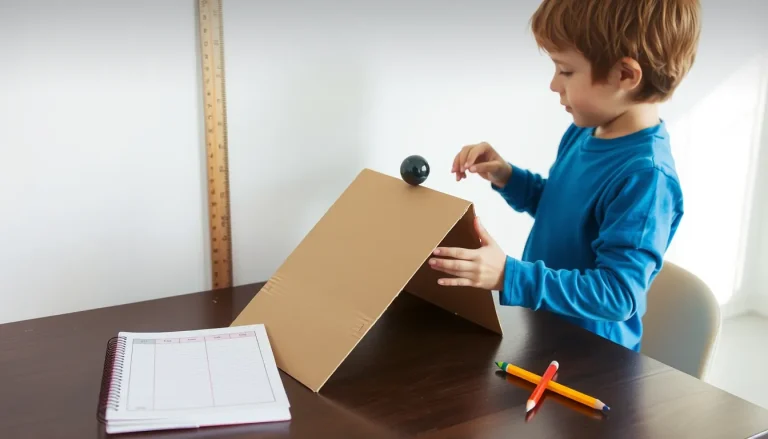
Understanding how different surfaces affect the motion of a toy car is a classic way to explore friction, a force that opposes sliding. This experiment lets children (ages 6‑14) compare several everyday materials—sandpaper, carpet, smooth wood, concrete, gravel, and plain paper—to discover which one creates the greatest resistance for a rolling car.
Orientation
The goal is simple: measure how far a toy car travels on a level track made of each surface. The shorter the distance, the higher the friction. By keeping every other factor the same (car, launch speed, track slope, etc.) the experiment isolates the surface as the only variable.
Before you begin
- Choose a quiet, flat area where the car can roll without being disturbed.
- Gather an adult to help set up the ramp or launcher and to ensure consistent release of the car.
- Plan for about 30 minutes of active work plus 10‑15 minutes for clean‑up.
Materials
- One toy car with wheels that roll freely (e.g., a Matchbox, Hot Wheels, or small radio‑controlled car).
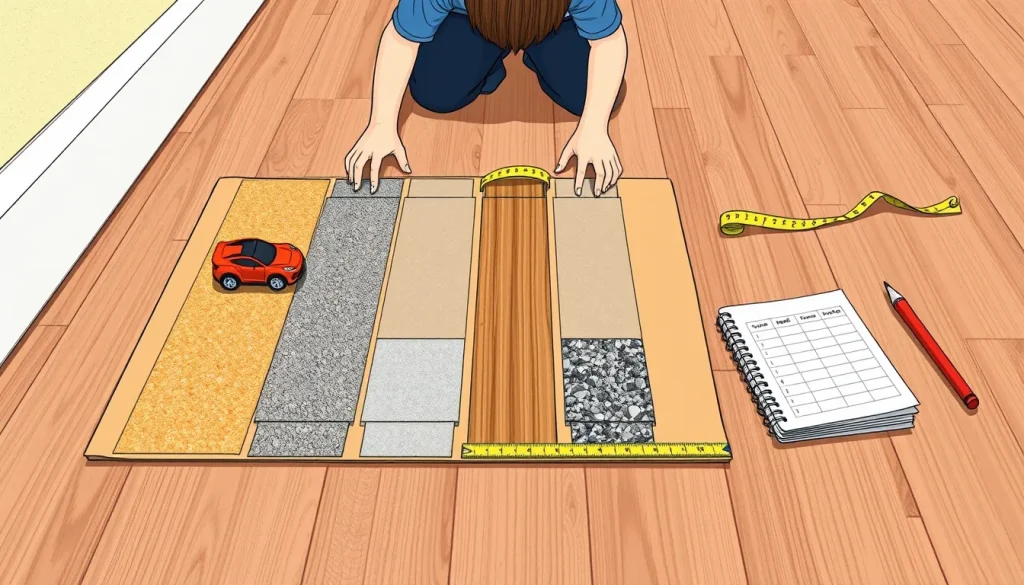
- A straight track about 2 m long. A piece of cardboard or a wooden board works well.
- Six surface samples, each at least 30 cm long and as wide as the track:
- Fine‑grade sandpaper (from a craft store)
- Carpet or a thick rug square
- Smooth wood or laminate (a piece of a bookshelf or a cutting board)
- Concrete slab or a piece of a concrete paver
- Gravel spread on a tray
- Plain paper (printer or notebook paper)
- Sticky tape or clamps to secure each surface to the track.
- Measuring tape or ruler (centimetre marks).
- Stopwatch (optional, for speed measurements).
- Data‑recording sheet (provided below).
- Rubber bands or a simple elastic launcher to give the car a consistent push (optional).
Steps
- Lay the cardboard track on a flat floor. Make sure it does not wobble.
- Attach the first surface (e.g., sandpaper) to the track with tape, covering the entire length.
- Place the toy car at the start line. If you use a launcher, set it to the same stretch each time.
- Release the car without pushing it with your hand. Let it roll freely until it stops.
- Measure the distance from the start line to the point where the car comes to rest. Record the value in the data sheet.
- Return the car to the start line, remove the tape, and attach the next surface.
- Repeat steps 3‑5 for each surface. Perform at least three trials per surface to obtain a reliable middle value.
- When all surfaces have been tested, clean the track and store the materials.
What to observe or measure
For each trial record:
- Surface name
- Trial number
- Rolling distance (centimetres)
- Optional: time taken to stop (seconds) if you use a stopwatch.
After three trials, calculate the middle (median) distance for each surface. The surface with the smallest median distance creates the most friction.
Variables and controls
| Variable | Type | What to keep constant |
|---|---|---|
| Surface material | Independent | Only this changes between trials. |
| Car model and mass | Controlled | Use the same car for every test. |
| Launch speed | Controlled | Same launcher setting or same hand‑push force. |
| Track slope | Controlled | Track must be level; use a spirit level if available. |
| Ambient conditions | Controlled | Perform all trials in the same room, same temperature. |
| Measured outcome | Dependent | Rolling distance (or stop time). |
Repeated trials
Repeating each surface three times reduces random error caused by slight differences in release or surface placement. If the three values vary widely, check that the car was released the same way each time and that the surface is securely taped.
Data table
| Surface | Trial 1 (cm) | Trial 2 (cm) | Trial 3 (cm) | Median (cm) |
|---|---|---|---|---|
| Sandpaper | ||||
| Carpet | ||||
| Smooth wood | ||||
| Concrete | ||||
| Gravel | ||||
| Paper |
Graphing your results
If you wish to visualise the data, draw a bar chart. Place the surface types on the horizontal axis and the median rolling distance on the vertical axis (centimetres). The shortest bar indicates the highest friction.
The science explained
Friction is the force that opposes relative motion between two surfaces in contact. It arises from microscopic “bumps” and “valleys” that interlock when the surfaces press together. The larger and more irregular these bumps, the greater the resistance.
Two main factors control friction:
- Surface roughness. Rough surfaces (sandpaper, gravel) have many high points that catch the car’s wheels, converting kinetic energy into heat and sound, which slows the car quickly.
- Material composition. Some materials, such as rubber‑coated wheels on carpet, can increase the grip because the wheel material conforms to the surface.
In the experiment, the car’s mass and wheel condition stay the same, so the only way the friction force changes is through the surface. The equation F_friction = μ N tells us that friction (F_friction) equals the coefficient of friction (μ) multiplied by the normal force (N, essentially the weight of the car). Because N is constant, a larger μ (rougher or stickier surface) produces a larger friction force, resulting in a shorter travel distance.
Troubleshooting
- Car rolls unevenly. Check that the track is truly level; a slight incline can add extra acceleration.
- Wheel wobble or damage. Ensure the wheels spin freely and are not bent.
- Surface slipping off the track. Use enough tape or clamps so the surface does not shift during the run.
- Large variation between trials. Record the exact release method (e.g., stretch the elastic launcher to the same length) and practice a consistent motion.
Next steps
After identifying the most friction‑producing surface, children can explore extensions such as:
- Testing how adding weight to the car changes the distance on each surface.
- Comparing different wheel materials (plastic vs. rubber) on the same surface.
- Designing a “low‑friction” car by polishing wheels or adding ball‑bearing axles.
These follow‑up ideas turn the single‑variable experiment into a mini‑engineering challenge, reinforcing the link between observation, hypothesis, and design.
Related terms
- Friction
- A force that resists the relative motion of two surfaces in contact.
- Coefficient of friction
- A number (μ) that describes how easily two specific materials slide against each other.
- Normal force
- The perpendicular force that a surface exerts on an object resting on it; for a flat track it equals the object's weight.
Sources & references
- Car Friction: The Science of Going Fast | Activity | Education.com, https://www.education.com/activity/article/car-friction/
- Friction fair test: which surface slows a car most? Teacher Resource Book, https://codingireland.blob.core.windows.net/images/lesson-attachments/teacher-resource-pages/2026/09/lesson_22717_9084e6a0f1114e45992b58009b22a6b4.pdf
- Try This at Home Science: Friction Racers, http://www.mi-sci.org/wp-content/uploads/2020/07/Friction-Racers.pdf
- Hotwheels Friction Investigation, https://my3ml.org/couch/uploads/file/home-education/hotwheels-friction.pdf