Overview
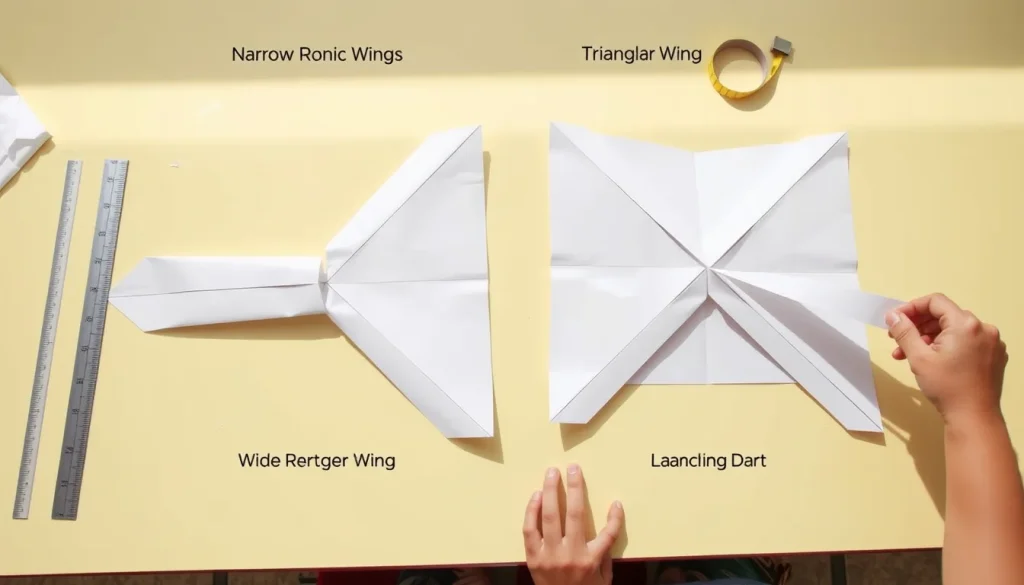
Paper airplanes are a favorite classroom and home activity, but not all designs travel the same distance. The shape of the wing—its width, length, and angle—determines how much lift is produced and how much drag slows the plane down. This experiment lets students test two classic wing shapes and decide which flies farther.
Testable Question
Does a wider, rectangular wing make a paper airplane travel farther than a narrow, triangular wing when all other factors are kept the same?
Hypothesis
Because a larger wing area generally creates more lift, we predict that the wide‑wing “Hunting” design will travel a greater distance than the narrow‑wing “Basic Dart” design.
Materials
- Standard 8.5″ × 11″ printer paper (one sheet per plane)
- Ruler (optional, for measuring wing span)
- Measuring tape or a 1‑meter yardstick
- Pencil for labeling planes
- Open indoor space (classroom or hallway) with minimal drafts
- Data recording sheet (provided below)
All items are commonly found at home or in a school supply closet.
Variables and Controls
| Variable | What to Keep Constant |
|---|---|
| Wing shape (design) | Two designs only: Hunting (wide) and Basic Dart (narrow) |
| Paper type & size | Same 8.5″ × 11″ printer paper for every plane |
| Throwing technique | Same adult or same student using a consistent arm motion and angle (approximately 45°) |
| Launch location | Same starting line for every trial |
| Environment | Indoor, still‑air conditions; avoid windows or fans |
Procedure (Steps)
- Print or copy the folding diagrams for the Hunting and Basic Dart airplanes. (You can find many free PDFs online; the designs used in the study by Haynes are widely shared.)
- Fold one Hunting plane and one Basic Dart plane using fresh sheets of paper. Label each with a pencil (e.g., “H‑1”, “D‑1”).
- Mark a launch line on the floor with tape. Measure exactly 1 meter from the line to the “landing zone” where you will record distances.
- Stand behind the launch line, hold the plane by the nose, and throw it with a smooth forward motion aimed about 45° upward. Use the same arm speed for every throw.
- Tip: practice a few throws with a single design before beginning data collection to settle on a repeatable motion.
- When the plane lands, measure the straight‑line distance from the launch line to the tip of the nose. Record the value in the data table.
- Return the plane to the launch line, re‑fold if the plane is damaged, and repeat.
- Complete at least 10 trials for each design. More trials (e.g., 20) give a clearer picture of variability.
- After all trials, calculate the average distance for each design and compare.
Repeated Trials
Repeating the throw ten times for each wing shape reduces the influence of random factors such as slight differences in hand motion or tiny air currents. The more trials you conduct, the more confident you can be in the average result.
Data Table (blank for recording)
| Trial | Design | Distance (cm) |
|---|---|---|
| 1 | Hunting | |
| 2 | Hunting | |
| 3 | Hunting | |
| 4 | Hunting | |
| 5 | Hunting | |
| 6 | Hunting | |
| 7 | Hunting | |
| 8 | Hunting | |
| 9 | Hunting | |
| 10 | Hunting | |
| 1 | Basic Dart | |
| 2 | Basic Dart | |
| 3 | Basic Dart | |
| 4 | Basic Dart | |
| 5 | Basic Dart | |
| 6 | Basic Dart | |
| 7 | Basic Dart | |
| 8 | Basic Dart | |
| 9 | Basic Dart | |
| 10 | Basic Dart |
What to Observe or Measure
- Distance traveled – measured in centimeters from launch line to nose tip.
- Flight pattern – note if the plane glides straight, swoops, or stalls.
- Consistency – look for large swings between trials, which may indicate uneven throws.
The Science Explained
Air flowing over a wing creates a pressure difference: lower pressure on top and higher pressure below, producing lift. The amount of lift roughly scales with the wing’s surface area. A wider wing, like the Hunting design, therefore generates more lift, allowing the plane to stay aloft longer and travel farther. However, a larger wing also presents more surface for air to push against, creating drag. The key is balancing lift and drag.
In a 2023 high‑school study, the wide Hunting plane averaged 2.44 m per flight, while the narrow Basic Dart averaged 1.71 m – a difference of 0.73 m, statistically significant (p < 0.0001)【1】. This real‑world data supports the hypothesis that greater wing area can increase distance, provided the plane’s weight and launch force stay constant.
Other factors such as wing camber (curvature), nose weight, and the angle of attack also affect performance, but they are held constant in this experiment.
Troubleshooting
- Inconsistent throws: If distances vary wildly, practice the launch motion until you can repeat it comfortably.
- Plane crashes immediately: Check that the folds are crisp and that the wing tips are not bent upward, which can stall the plane.
- Air currents: Conduct the test in a hallway with doors closed and no fans running.
Try Another Version
Once the basic comparison is complete, extend the investigation by changing one additional factor while keeping wing shape constant. Examples:
- Increase the nose weight with a small paperclip and see how distance changes.
- Fold a “glider” style wing (long and flat) and compare to the Hunting plane.
- Test the same designs using heavier cardstock to explore the role of mass.
Cleanup & Disposal
Collect all paper scraps and recycle them. Store the folded planes in a dry folder if you plan to reuse them for later flights.
Next Steps
Summarize the results in a simple bar graph (average distance for each design) and discuss why the data matched or differed from the hypothesis. Share the findings with classmates, a homeschooling group, or on a family science night.
Related terms
- Lift
- An upward force created by air moving faster over the top of a wing than underneath, which helps keep the plane aloft.
- Drag
- A resisting force caused by air pushing against the surfaces of the plane, slowing its forward motion.
- Wing surface area
- The total area of a wing; larger surface area generally produces more lift but also more drag.
Sources & references
- Haynes, Makaylee. “The Effect of a Paper Airplane’s Wing Shape on the Distance the Paper Airplane Can Fly.” Society for Science, https://abstracts.societyforscience.org/Home/PrintPdf/20812
- Carlberg, Rosalie et al. “What Paper Airplane Flies the Farthest?” Cleveland State University, https://www.csuohio.edu/sites/default/files/26WhatPaperAirplaneFliestheFarthest.pdf
- Scientific American. “Soaring Science: Test Paper Planes with Different Drag.” https://www.scientificamerican.com/article/bring-science-home-paper-planes-drag/