Overview
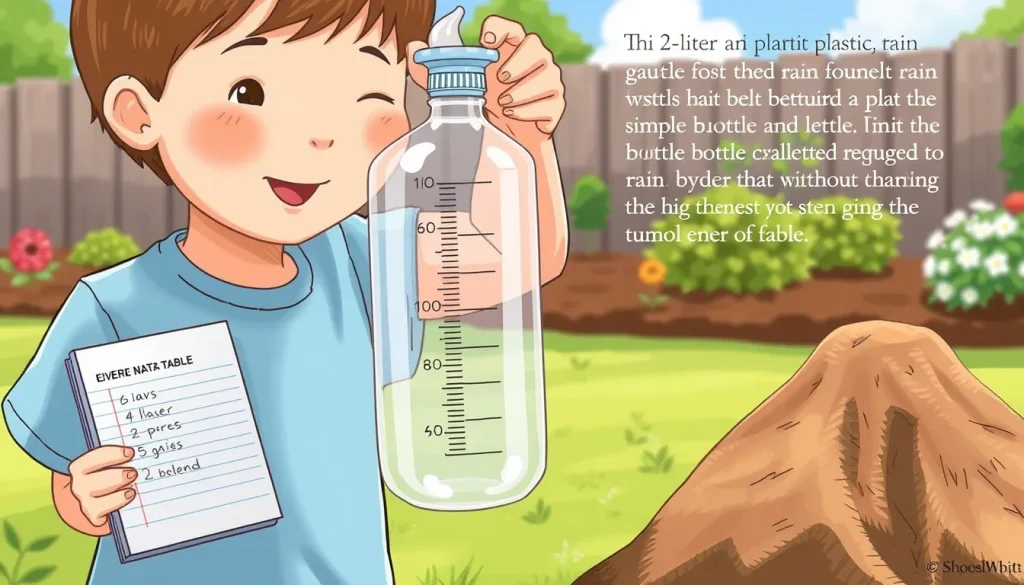
Rain gauges are the simplest weather instrument: they collect falling precipitation and let us read the depth of water that has landed on a known area. By building a rain gauge from a recycled plastic bottle, children experience the full engineering cycle – from defining a problem, choosing materials, and creating a prototype, to testing, recording data, and improving the design. The activity aligns with Earth & Weather concepts and is appropriate for beginners (ages 6‑14).
Before You Begin
- Workspace: Choose a flat, dry surface such as a kitchen table. Have a pair of safety scissors, a ruler, a permanent marker, and tape within reach.
- Adult supervision: Cutting the bottle and handling sharp tools requires an adult. Younger children should be guided through each step.
- Location for the gauge: Pick an open spot in the yard away from trees, roofs, or over‑hanging gutters. The site should be level and receive direct rainfall.
Materials
- 1 empty 2‑liter plastic soda bottle (clear preferred) – the main collecting container.
- Scissors (or a utility cutter) – to cut the bottle.
- Permanent marker or waterproof tape – for the measurement scale.
- Sticky tape or duct tape – to secure the funnel.
- Ruler (centimetre or inch scale) – to draw the scale.
- Optional: a few centimetres of jelly cubes (as in the Met Office method) to create a flat bottom if the bottle’s base is uneven.
Design Constraints and Success Criteria
The challenge is to create a rain gauge that meets the following constraints:
- Material limit: Only the items listed above (recycled plastic bottle and basic office supplies).
- Size limit: The collecting cylinder must be at least 10 cm tall to hold a useful amount of rain.
- Calibration: The scale on the side must be accurate to 1 mm (0.1 cm) or 0.04 inches.
- Stability: The gauge must stay upright in wind up to a gentle breeze (≈10 km h⁻¹).
Success is measured by:
- Clear, evenly spaced markings that correspond to the volume of water collected.
- Ability to read the water depth without removing the bottle.
- Consistent daily measurements over at least one week.
Step‑by‑Step Build Procedure
- Prepare the bottle. Rinse the empty soda bottle and remove any label. Place it on its side and locate the point where the bottle starts to narrow (the “shoulder”).
- Cut the top. Using scissors, cut around the bottle about two‑thirds of the way up, leaving a wide lower section and a narrower upper section. This follows the method described by NASA’s Rain Gauge Design Challenge and the Met Office guide[1], [2]. Be careful of sharp edges.
- Create a funnel. Turn the cut‑off top piece upside down and insert it into the bottom half so that the narrow opening points downward, forming a funnel. Secure it with a strip of tape if it wobbles.
- Make a flat bottom (optional). If the bottle’s base is uneven, pour a few centimetres of gelatin (made from jelly cubes) into the bottom to harden a level surface. This technique is recommended by the Met Office to improve measurement accuracy.
- Mark the scale. Using a ruler, measure and mark every centimetre (or every tenth of an inch) on the side of the bottle. Write the numbers directly with a permanent marker, or attach a strip of coloured tape and write on the tape for better visibility. Ensure the marks start at the bottom of the collecting area, not the funnel tip.
- Secure the gauge. Bury the bottle’s base in a shallow hole so that the top of the funnel sits level with the ground. This prevents the gauge from tipping over on windy days (as suggested in the NC State “Really Rad Rain Gauge” instructions[3]).
- Test the gauge. Pour a known volume of water (e.g., 100 mL) into the funnel and check that the water level aligns with the expected mark (approximately 1 mm per 0.1 mL for a 10 cm × 10 cm cylinder). Adjust the scale if necessary.
- Start data collection. Place a notebook or a printed data sheet nearby. Record the date, time, and water depth each day at the same hour (e.g., 7 pm). Empty the bottle after each reading and note the amount emptied.
What to Observe or Measure
Each day, observe and record:

- Date and time. Consistency reduces variability caused by late‑day evaporation.
- Water depth. Read the scale in centimetres (or millimetres). If you prefer metric, 1 cm = 10 mm.
- Weather notes. Cloud cover, temperature, and any wind that might have affected collection.
Use the following simple table (you can copy it onto paper):
| Date | Time | Depth (cm) | Notes |
|---|---|---|---|
The Science Explained
Rainfall depth is expressed as the height of water that would cover a flat surface of the same area as the gauge’s opening. Because the gauge’s opening is a known diameter (usually about 6 cm for a standard 2‑liter bottle), the measured depth directly represents the amount of precipitation that fell over that area. The funnel minimizes splash losses and directs water into the measuring cylinder, while the sealed bottom prevents evaporation during the short interval between readings.
Key concepts introduced:
- Calibration: Aligning the scale with the actual volume of water ensures accurate readings.
- Measurement uncertainty: Small errors can arise from parallax (reading the scale from an angle) and from water surface tension that slightly raises the meniscus.
- Sampling bias: Placing the gauge near trees or buildings can under‑ or over‑estimate true rainfall because of shelter or runoff.
Troubleshooting
- Gauge tips over. Dig a deeper hole or add weight (a small rock) inside the bottom half.
- Scale is unreadable. Use coloured tape strips for each 1 cm increment; it provides higher contrast than marker on clear plastic.
- Water level rises too fast. The funnel may be too large; cut the top piece a little smaller to reduce overflow.
- Inconsistent daily readings. Record at the same clock time each day and empty the gauge promptly after each measurement.
Next Steps
Once the basic gauge is working, families can extend the challenge:
- Compare two gauges with different funnel shapes to see which collects more water.
- Calculate total monthly rainfall by summing daily depths and converting to millimetres (1 mm of rain equals 1 L of water per square metre).
- Integrate the data into a simple line graph to visualise rainfall trends over weeks.
These extensions reinforce data‑handling skills and deepen the understanding of weather patterns, completing the engineering design cycle from problem definition to iterative improvement.
Related terms
- Calibration
- Adjusting a measuring device so that its readings match known standards.
- Precipitation
- Any form of water – liquid or solid – that falls from the atmosphere to the ground.
- Meniscus
- The curved surface of a liquid in a container, caused by surface tension.
Sources & references
- https://gpm.nasa.gov/education/interactive/rain-gauge-design-challenge
- https://weather.metoffice.gov.uk/learn-about/met-office-for-schools/other-content/other-resources/weather-station/rain-gauge
- https://growforit.ces.ncsu.edu/activities-for-kids/really-rad-rain-gauge/
- https://www.watereducation.org/sites/main/files/file-attachments/3_raingaugedesigninstructions.pdf