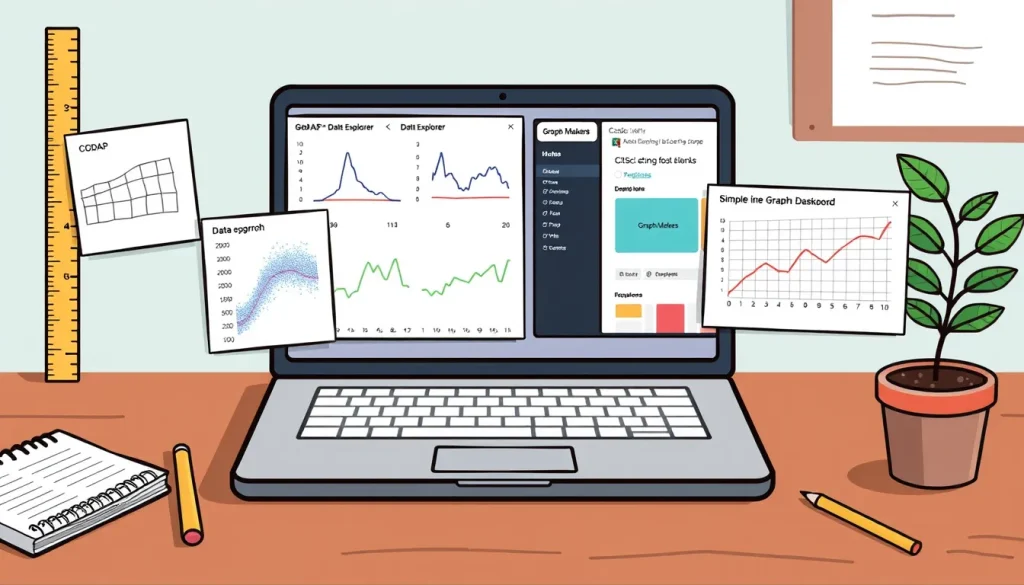
Gathering data is only half the scientific process; students also need to turn numbers into pictures that tell a story. The good news is that several high‑quality, free web applications let children (and their adult guides) create professional‑looking graphs, run simple statistical tests, and publish their results with a single link. This guide compares four such tools, explains how to get started, and walks through a complete example using a plant‑growth experiment.
Before You Begin
- Device and connection: A laptop, tablet, or desktop with a modern web browser (Chrome, Firefox, Edge, or Safari) and broadband internet is sufficient.
- Account needs: CODAP and Data Explorer work without a personal account; CitSci.org requires a free sign‑up; Graph Makers are instantly available.
- Data format: Most tools accept a simple spreadsheet (CSV) or manual entry of rows and columns. Prepare your data in a table with clear column headings before you start.
Materials
- Computer or tablet with internet access.
- Collected data – for example, a list of plant heights measured each day.
- Optional: a spreadsheet program (Google Sheets, Excel, or LibreOffice) to organize data before uploading.
Choosing the Right Tool
All four platforms are free, but they differ in purpose and depth. Use the table below to decide which best matches your project.
| Tool | Best For | Key Features | Sharing Method |
|---|---|---|---|
| CODAP | Interactive data exploration in math‑science curricula (grades 5‑14) | Drag‑and‑drop graph building, real‑time statistics, open‑source plugins | Shareable URL or export PNG/CSV |
| Data Explorer | Quick plots and hypothesis testing with authentic research data | Built‑in statistical tests, easy import of CSV, curated science datasets | Link to saved project or download image/CSV |
| CitSci.org | Collecting, managing, and publishing citizen‑science datasets | Project dashboards, map visualizations, community collaboration | Public project page with embedded graphs |
| Graph Makers (Virtual Science Teachers) | Simple, single‑graph creation for quick classroom use | Eight dedicated makers (line, bar, scatter, etc.), instant preview | Download PNG or copy‑paste image into reports |
Tool 1 – CODAP (Common Online Data Analysis Platform)
CODAP is a free, web‑based app designed specifically for students working with data in any subject. It offers a visual, drag‑and‑drop interface that lets learners build scatter plots, line graphs, bar charts, and more without writing code. Because it is open‑source, teachers can add plugins for extra functionality.[1]
How to Plot Data in CODAP
- Visit codap.concord.org and click “Start a New Document.”
- Choose “Import Data” and upload your CSV file, or click “Enter Data” to type values manually.
- After the table appears, select the columns you want on the axes. Drag the column header to the “X‑Axis” or “Y‑Axis” area of the graph pane.
- Customize the graph: change colors, add a trend line, or display mean and standard deviation via the “Graph Settings” menu.
- To share, click the “Share” icon and copy the generated URL. Anyone with the link can view (or edit, if you enable collaboration).
- Export options include PNG image, CSV of the plotted data, or a PDF of the entire document.
When CODAP Shines
- Students need to explore relationships between variables (e.g., temperature vs. reaction time).
- Projects benefit from real‑time statistical calculations.
- Teachers want a platform that can be extended with custom plugins.
Tool 2 – Data Explorer (BioInteractive)
Data Explorer provides a quick way to visualize and analyze authentic scientific data sets. It is especially useful for biology or earth‑science projects that require hypothesis testing, such as comparing growth rates under different light conditions.[2]
Steps to Create a Plot
- Go to the Data Explorer homepage and click “Create New Project.”
- Upload your own CSV file or select one of the curated datasets.
- Choose a plot type (scatter, bar, histogram) from the menu.
- Assign variables to the X and Y axes by selecting column names.
- Under “Statistical Analysis,” pick a test (t‑test, ANOVA) if you need to compare groups.
- Click “Generate Plot.” The tool instantly produces a labeled graph with confidence intervals if requested.
- Save the project by clicking “Share” – a permanent link is created, or download the image/CSV for a report.
Why Use Data Explorer
- Ideal for short‑term classroom activities where time is limited.
- Built‑in statistical tests remove the need for separate software.
- Curated datasets provide ready‑made examples for teacher modeling.
Tool 3 – CitSci.org (Citizen Science Platform)
CitSci.org is a free online community that supports the entire data‑life cycle: collection, management, visualization, and public sharing. While it does not specialize in graph creation, it excels at publishing data sets that can be explored by peers, mentors, or the wider public.[3]
Getting Started
- Create a free account with an email address.
- Start a new project, give it a clear title (e.g., “Backyard Bird Counts”).
- Define the data fields you will collect (species, date, location, count).
- Enter observations directly on the website or upload a CSV of completed data.
- Use the built‑in “Charts” tab to generate bar or line graphs of your data.
- Publish the project – a public URL lets anyone view the dataset and its visualizations.
Best Use Cases
- Long‑term monitoring projects (weather, phenology, biodiversity).
- Collaborative class projects where multiple groups contribute data.
- When you want to keep data openly accessible for future analysis.
Tool 4 – Graph Makers (Virtual Science Teachers)
The Graph Makers suite offers eight dedicated, single‑purpose graph creators (line, bar, scatter, etc.). They are perfect for quick, one‑off visualizations that can be downloaded as PNG images and inserted into lab reports.[4]
Typical Workflow
- Choose the appropriate graph type (e.g., “Line Graph Maker – Multiple Sets”).
- Enter your data into the provided table – each column represents a data series.
- Adjust axis labels, scales, and legend as needed.
- Click “Create Graph.” The preview appears instantly.
- Download the image or copy it to the clipboard for pasting into a document.
When to Use Graph Makers
- When the class needs a fast visual without learning a full platform.
- For single‑variable comparisons (e.g., temperature over a week).
- When internet bandwidth is limited – the tools run quickly and require only a small amount of data.
Worked Example: Plotting Plant‑Growth Data with CODAP
Suppose a class measures the height of a bean seedling over five days. The data table looks like this:
| Day | Height (cm) |
|---|---|
| 0 | 2 |
| 1 | 3.5 |
| 2 | 5 |
| 3 | 6.8 |
| 4 | 8.2 |
Follow these steps in CODAP:
- Save the table as
bean_growth.csv(comma‑separated values). - Open CODAP, click “Import Data,” and select the CSV file.
- Drag the “Day” column to the X‑axis and “Height (cm)” to the Y‑axis.
- From the graph menu, add a linear trend line. CODAP automatically displays the equation (e.g., Height = 1.55·Day + 2.0) and R² value.
- Click the “Share” button, copy the URL, and paste it into the class discussion board. Peers can view the graph and even add their own data points.
- Export the graph as a PNG file to include in a written report.
This workflow demonstrates how a student can move from raw measurements to a shareable visual without installing any software.
Troubleshooting Common Issues
- Browser won’t load the tool: Ensure you are using an up‑to‑date browser. Clear cache or try a different browser if the page remains blank.
- Data won’t import: Check that the CSV uses commas (or tabs, if specified) and that the first row contains column headers without special characters.
- Graph looks wrong (axes reversed, missing points): Verify that numeric columns are recognized as numbers, not text. In CODAP, you can click a column header and choose “Convert to Numeric.”
- Sharing link is private: Some platforms default to private projects. Look for a “Make Public” or “Share Settings” option before copying the URL.
- Statistical test says “insufficient data”: Most tests require at least two groups with a minimum of three observations each. Add more trials or combine similar groups.
Next Steps
Once a graph is created, you can:
- Embed the live CODAP or Data Explorer link in a Google Slides presentation.
- Export the data set and import it into a spreadsheet for further calculations (e.g., growth rate per day).
- Invite classmates to collaborate on the same project, turning a single graph into a shared data hub.
- Use the exported PNG in a printed lab report or on a poster for a science fair.
All four tools are free, require only a web browser, and support the core scientific practice of turning observations into evidence that can be communicated clearly.
FAQ
Do I need to create an account to use CODAP or Data Explorer?
No. Both CODAP and Data Explorer allow you to start a new document and create graphs without signing up. Only CitSci.org requires a free account for publishing projects.
Can I import data from Google Sheets into these tools?
Yes. Export your Google Sheet as a CSV file and then upload it to CODAP, Data Explorer, CitSci.org, or the Graph Makers. All four platforms accept standard CSV files.
What types of graphs can I create with the Graph Makers suite?
The suite includes eight dedicated makers for line, bar, scatter, column, area, histogram, pie, and bubble charts, each optimized for quick single‑graph creation.
How can I share a graph with classmates who don’t have an account?
CODAP, Data Explorer, and CitSci.org generate a shareable URL that anyone can open in a web browser. You can also download the graph as a PNG or PDF and attach it to an email or learning management system.
Are these tools suitable for high‑school level data analysis?
Yes. CODAP supports grades 5‑14 and includes real‑time statistics. Data Explorer offers built‑in t‑tests and ANOVA, making it appropriate for high‑school biology, earth‑science, and physics projects.
Related terms
- CSV (Comma‑Separated Values)
- A plain‑text file format where each line represents a row of data and each value is separated by a comma, commonly used for importing and exporting spreadsheet data.
- Shareable URL
- A web link generated by a tool (e.g., CODAP) that allows others to view or edit the same graph or dataset without needing to install software.
- Trend line
- A line added to a scatter plot that shows the overall direction (slope) of the data points, often accompanied by its equation and R² value.
- Citizen science
- Scientific research conducted by members of the public, often coordinated through platforms like CitSci.org that collect, manage, and share data.
- Statistical test
- A mathematical procedure (e.g., t‑test, ANOVA) used to determine whether observed differences between data groups are likely due to chance.
Sources & references
- Common Online Data Analysis Platform (CODAP) – https://codap.concord.org/ [1]
- Data Explorer – https://www.biointeractive.org/classroom-resources/data-explorer [2]
- CitSci.org FAQ – https://citsci.org/faqs [3]
- Graph Makers – Virtual Science Teachers – https://virtualscienceteachers.org/graph-makers/ [4]