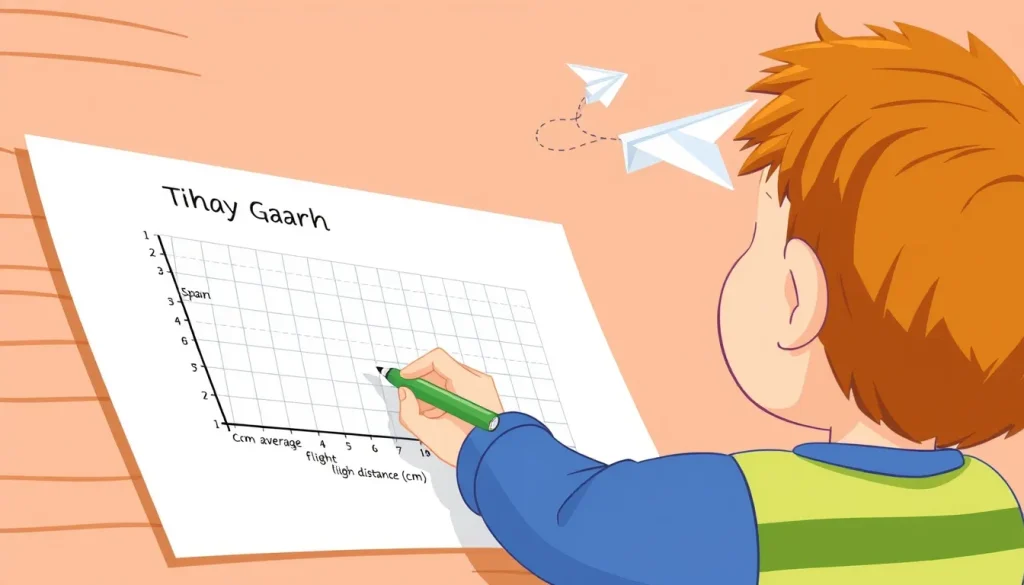
Graphs are the visual language of science. A well‑labelled graph lets a reader see the pattern in the data without having to read a paragraph of description. For children aged 6‑14, mastering the basics of graph titles, axis labels, and units is a foundational skill that supports later work in physics, chemistry, biology and engineering. This guide walks you through a complete, hands‑on experiment – measuring how far a paper airplane flies as you change its wing span – and shows, step by step, how to turn the measurements into a correctly labelled graph.
Orientation: What This Project Teaches
By the end of the activity, learners will be able to:
- Identify the independent (controlled) and dependent (measured) variables.
- Choose an appropriate, concise graph title.
- Write axis labels that include the quantity name and its unit.
- Plot data points accurately and draw a best‑fit line or curve.
- Explain, in plain language, what the graph tells us about the relationship between wing span and flight distance.
Before You Begin
This experiment needs a quiet indoor space where a paper airplane can be launched without hitting break‑away objects. An adult should supervise the cutting of paper and the use of a ruler. If children are younger than eight, the adult should cut the wings to the required lengths.
Materials
- Standard A4 or Letter‑size paper (one sheet per trial) – Paper
- Cardboard strip (about 30 cm long, 2 cm wide) for a ruler – Cardboard
- Scissors
- Pencil and eraser
- Graph paper (grid of 1 cm squares) or a printable graph template
- Measuring tape or a marked ruler (for distance travelled)
- Stopwatch (optional, if you wish to record flight time as a secondary variable)
Steps: Building and Testing the Airplane
- Draw a simple “dart”‑style paper airplane on a fresh sheet of paper. Fold the centreline, then fold the wings down so that the wing tip aligns with the top of the fuselage.
- Using the cardboard ruler, measure and mark three wing‑span lengths: 10 cm, 12 cm, and 14 cm from the fuselage to the wing tip. Cut the wings at each mark to create three separate airplanes, each with a different wing span.
- Number the airplanes 1, 2 and 3 so you can keep track of which wing span belongs to which trial.
- Stand at a fixed launch line (e.g., a piece of tape on the floor). Hold the airplane by the nose, aim straight ahead, and give a consistent, gentle throw. Record the landing point by measuring the distance from the launch line to the tip of the airplane’s nose.
- Repeat the launch three times for each wing‑span airplane, trying to use the same force each time. Write the three distances in the data table (see below).
- Calculate the average distance for each wing span. This average will be the value you plot on the graph.
What to Observe or Measure
For each trial you will record:
- Wing span (cm) – the independent variable you set by cutting the wings.
- Flight distance (cm) – the dependent variable measured with the tape measure.
- Optional: Flight time (seconds) – if you want a second graph.
Variables and Controls
Independent variable: Wing span (the quantity you deliberately change).
Dependent variable: Flight distance (the outcome that changes because of the wing span).
Controlled variables (kept the same for every trial):
- Paper type and size.
- Throwing technique – same hand position and force.
- Launch location and indoor conditions (no wind).
Data Table
| Wing span (cm) | Trial 1 distance (cm) | Trial 2 distance (cm) | Trial 3 distance (cm) | Average distance (cm) |
|---|---|---|---|---|
| 10 | ||||
| 12 | ||||
| 14 |
Graphing Your Results
Now turn the numbers into a picture. Follow the standards set by Qualifications Scotland and the BBC to ensure the graph is scientifically acceptable.
- Choose the graph type: A simple scatter plot with a line of best fit works well for a single quantitative relationship.
- Title the graph: The title must be concise and describe exactly what is plotted. For this experiment a good title is “Average Flight Distance vs Wing Span”. Avoid vague titles like “Airplane Test”.
- Label the axes:
- The horizontal (x‑axis) always carries the independent variable. Write
Wing span (cm)– the quantity name followed by its unit in parentheses. - The vertical (y‑axis) carries the dependent variable. Write
Average flight distance (cm).
These conventions match the guidance that “the independent variable … is plotted along the horizontal axis and the dependent variable … along the vertical axis”[1].
- The horizontal (x‑axis) always carries the independent variable. Write
- Set a scale: Choose evenly spaced tick marks that end in 0 or 5 where possible, as recommended by the Chem Lab guide[4]. For wing span, 5‑cm intervals work (0, 5, 10, 15…). For distance, 20‑cm intervals (0, 20, 40, 60…) usually fill half the page.
- Plot the points: For each wing‑span value, place a dot at the corresponding average distance.
- Draw the trend line: If the points look roughly straight, draw a straight line of best fit. If they curve, sketch a smooth curve that follows the pattern.
- Check the graph: Make sure the title, axis labels, and units are all present and legible. The graph should occupy at least half of the page, as suggested by the BBC standards[3].
Worked Example
Suppose the recorded averages are:
- Wing span 10 cm → 45 cm
- Wing span 12 cm → 58 cm
- Wing span 14 cm → 70 cm
The graph would look like this (illustrative only):
Title: Average Flight Distance vs Wing Span
x‑axis label: Wing span (cm)
y‑axis label: Average flight distance (cm)
Points plotted at (10, 45), (12, 58), (14, 70) with a rising straight‑line trend.
This example shows a clear positive relationship: longer wings let the airplane travel farther. The graph’s label structure follows the official requirement that the title “must be concise and describe exactly what the graph depicts”[1].
Troubleshooting Common Labeling Mistakes
- Missing units: If you write only “Wing span” or “Distance”, the reader cannot compare numbers. Always add the unit in parentheses.
- Swapped axes: Plotting the dependent variable on the horizontal axis reverses the cause‑effect relationship and violates the convention that the independent variable is on the x‑axis.
- Vague title: Titles like “Airplane Test” do not tell the viewer what is being compared. Include both variables, e.g., “Distance vs Wing Span”.
- Uneven scales: Using irregular intervals makes it hard to see the true shape of the data. Keep each axis evenly spaced.
The Science Explained
A paper airplane’s flight is governed by basic aerodynamics. The wing span influences lift – the upward force that keeps the plane aloft. Longer wings generate more lift at a given speed, allowing the airplane to stay in the air longer and travel farther. However, extremely long wings also add drag, which can slow the plane. In this simple range (10‑14 cm) the lift effect dominates, giving the upward trend seen in the graph.
Understanding the relationship between a controllable design feature (wing span) and a measurable outcome (flight distance) mirrors real‑world engineering: designers tweak dimensions and test the effect, then record the results in a graph. By mastering axis labels, children learn the language that scientists use to share such findings.
Next Steps
Once the basic graph is mastered, you can extend the investigation:
- Vary the paper type (thin printer paper vs heavier cardstock) and add a second graph titled “Distance vs Paper Weight”.
- Record flight time and plot “Flight time vs Wing span” to see if longer wings also lengthen the airborne period.
- Try a different airplane design (e.g., a “glider”) and compare the two sets of graphs.
Each new graph follows the same labeling rules, reinforcing the skill while deepening scientific understanding.
Related terms
- Independent variable
- The quantity that the experimenter changes on purpose; shown on the x‑axis.
- Dependent variable
- The quantity that changes as a result of the independent variable; shown on the y‑axis.
- Axis label
- Text that names a graph axis and includes the unit of measurement in parentheses.
- Graph title
- A concise statement that tells the reader exactly what the graph depicts.
Sources & references
- Qualifications Scotland – Understanding Standards: Graphing Requirements, https://www.understandingstandards.org.uk/Subjects/NPA/NPAScience/Graphing-Requirements
- BBC Bitesize – Graphs and charts – Working scientifically, https://www.bbc.co.uk/bitesize/articles/zhmbvwx
- BBC Bitesize – Analysing experimental data (CCEA) – Graph, https://www.bbc.co.uk/bitesize/guides/zhg3hbk/revision/2
- Chem Lab – Preparing Graphs, https://chemlab.truman.edu/data-analysis/preparing-graphs/