Overview
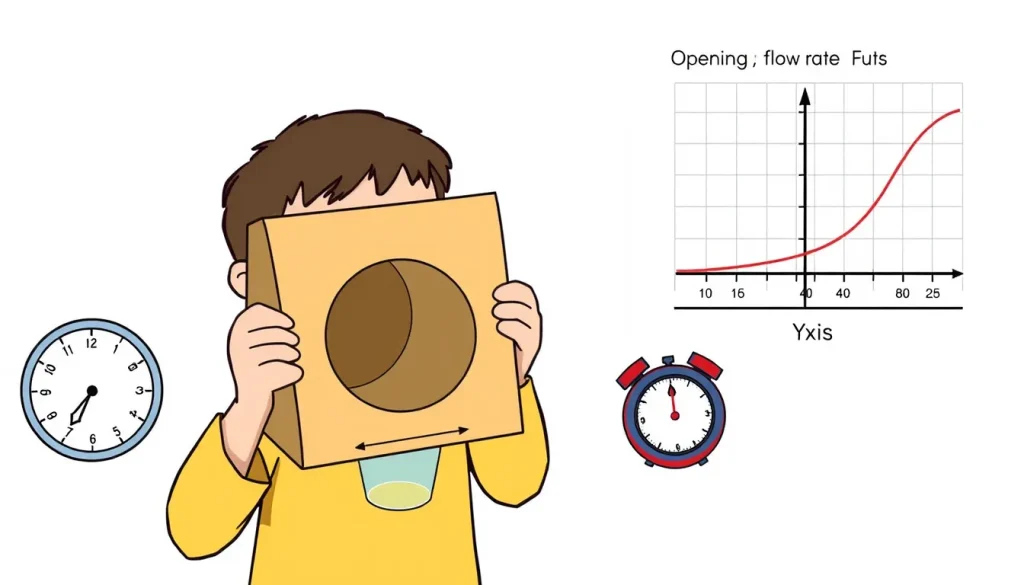
This engineering challenge asks children to design a simple cardboard funnel, vary the width of its opening, and discover how that width changes the amount of water that passes through each second. The activity combines hands‑on construction, quantitative measurement, and iterative redesign—key practices of real‑world engineering.
Before you begin
- Workspace: Use a sturdy table covered with a plastic sheet or newspaper. The activity will involve spilling water, so a washable surface is best.
- Adult supervision: Required for cutting cardboard, handling scissors, and supervising the use of a stopwatch.
- Safety: Keep the floor dry to prevent slips. If using a kitchen knife, only an adult should handle it.
Materials
- Heavy‑weight cardboard (e.g., from a shipping box) – at least two 30 × 30 cm sheets.
- Scissors or a craft knife.
- Ruler and permanent marker.
- Clear tape or hot‑glue gun.
- Measuring cup (100 ml graduations).
- Stopwatch (phone timer works).
- Water source (a pitcher or faucet).
- Optional: Small digital kitchen scale for weight‑based timing (see source [4]).
Design Goal and Constraints
Goal: Create a funnel that delivers the highest possible flow rate (volume per second) while using only the provided cardboard.
Constraints:
- The funnel must be a single piece of cardboard rolled into a cone shape and secured with tape or glue.
- The total height of the funnel cannot exceed 20 cm.
- The opening (the circular mouth at the top) must be cut to a specific diameter; you will test at least three different diameters (e.g., 4 cm, 6 cm, 8 cm).
- No additional holes or perforations are allowed inside the funnel walls.
Success Criteria
- Record the flow rate for each tested opening width in milliliters per second (ml ⁄ s).
- Identify which opening width produces the greatest flow rate.
- Explain the observed relationship using basic fluid‑dynamic ideas (see “The Science Explained”).
Procedure
- Cut the funnel body. Draw a 20 cm‑high rectangle 15 cm wide on the cardboard. Roll it into a cone and tape the seam, forming a basic funnel with a small opening at the top.
- Mark opening sizes. Using the ruler and marker, draw three circles on the top edge of the cone with diameters 4 cm, 6 cm, and 8 cm (or any three sizes you choose). Cut each circle out to create three separate funnels.
- Seal the bottom. Cut a small circular piece of cardboard to fit the narrow end of each funnel and tape it securely – this will be the outlet.
- Set up the test. Place a clean measuring cup directly beneath the outlet. Fill a 500 ml beaker with water.
- Measure flow rate. Quickly pour the water into the funnel and start the stopwatch simultaneously. Stop timing when the water level in the cup reaches 250 ml (or when the beaker empties, whichever comes first). Record the elapsed time in seconds.
- Flow rate = Volume (ml) ÷ Time (s). For example, 250 ml ÷ 12 s = 20.8 ml ⁄ s.
- Repeat. Perform at least three trials for each opening size, resetting the water and cup each time.
- Optional weight method. If you have a kitchen scale, place the empty funnel on the scale, tare it, then add water and record the weight change over time. This method mirrors the approach described in a Texas Instruments draining‑funnel activity [4].
- Record data. Use the provided data table (see below) to log each trial’s time and calculated flow rate.
- Analyze. Average the flow rates for each opening size and compare.
What to observe or measure
For each trial you will record:

- Opening diameter (cm).
- Trial number.
- Time to collect the chosen volume (seconds).
- Calculated flow rate (ml ⁄ s).
Note any irregularities, such as splashing, wobbling of the funnel, or water that clings to the cardboard walls.
Variables and Controls
- Independent variable: Diameter of the funnel’s top opening.
- Dependent variable: Flow rate (ml ⁄ s).
- Controlled variables: Funnel height, material (same cardboard), outlet size, water temperature, initial water volume, and measurement method.
Data Table
| Opening Diameter (cm) | Trial | Time (s) | Volume Collected (ml) | Flow Rate (ml ⁄ s) |
|---|---|---|---|---|
| 1 | 250 | |||
| 2 | 250 | |||
| 3 | 250 | |||
| 1 | 250 | |||
| 2 | 250 | |||
| 3 | 250 | |||
| 1 | 250 | |||
| 2 | 250 | |||
| 3 | 250 |
Analyzing the Results
1. Average each set. Add the three flow‑rate values for a given diameter and divide by three.
2. Graph the relationship. Plot opening diameter on the horizontal axis and average flow rate on the vertical axis. A straight‑line trend suggests a proportional relationship, while a curve indicates more complex behavior.
3. Interpret. Larger openings usually allow more water to pass per second because the cross‑sectional area is bigger. However, if the opening becomes too large relative to the funnel’s height, the water may separate from the walls, reducing the effective driving pressure and slowing the flow. This mirrors findings from classroom funnel‑flow investigations where hole size and column height controlled the emptying rate [1][4].
Iterating the Design
After the first round of testing, use the data to improve the funnel:
- Choose the opening that gave the highest flow rate.
- Modify another aspect—such as taper angle or outlet size—while keeping the successful opening constant.
- Retest using the same measurement protocol.
- Record the new results and compare them to the original baseline.
Repeated cycles illustrate the engineering process: define a problem, prototype, test, evaluate, and redesign.
Troubleshooting
- Water drips around the seam. Ensure the seam is tightly taped; leaks reduce the measured flow rate.
- Inconsistent timing. Use the same person to start/stop the stopwatch, or switch to the weight‑sensor method for more precise timing.
- Funnel collapses. Reinforce the cone with an extra strip of cardboard on the outside.
Try another version
Explore how multiple small holes compare to one large opening. Cut several 1‑cm holes in the top of a funnel and repeat the measurements. This extension connects to the multi‑hole experiments described in a plastic‑bottle funnel study [1].
Cleanup and disposal
Wipe up spilled water, recycle the cardboard scraps, and store the remaining funnels for future challenges.
The science explained
Water flows through an opening because of a pressure difference between the water column inside the funnel and the air outside. The larger the opening’s cross‑sectional area (A), the more space there is for water molecules to move, so the volumetric flow rate (Q) increases roughly in proportion to A, according to the equation Q = A · v, where v is the average velocity of the water exiting the funnel.
Bernoulli’s principle tells us that as water moves faster through a narrower passage, its pressure drops. In a simple funnel, the dominant factor is the size of the opening; a wider opening reduces resistance and lets gravity pull the water faster, a trend confirmed in classroom investigations of hole size and column height [1]. When the opening becomes very large relative to the funnel height, the water’s speed is limited by the height of the water column (the “head”) rather than the opening size, which can cause the flow rate to level off or even decrease.
Measuring flow rate by timing a known volume (or by weighing the water) provides a direct, quantitative way to see these principles in action, as demonstrated in a Texas Instruments weight‑based funnel‑draining activity [4].
Related terms
- Flow rate
- The volume of fluid that passes a point per unit time, usually expressed in milliliters per second (ml ⁄ s).
- Cross‑sectional area
- The size of the opening through which fluid can flow; larger area generally allows a higher flow rate.
- Bernoulli’s principle
- A principle in fluid dynamics stating that an increase in a fluid’s speed occurs simultaneously with a decrease in pressure or potential energy.
Sources & references
- Bartholow, M. (2004). Determining Rate of Flow through a Funnel. Journal of Chemical Education. https://doi.org/10.1021/ed081p672
- Texas Instruments. (2005). Funnel Volumes: Volume and Weight. https://education.ti.com/-/media/25731A1CDCF8402D85F46A604EDFBD17